Product intelligence
Fractured data, consolidated into one picture. Then taught to find the problems itself.
The problem in front of me
The data existed. It just lived in six places, owned by six teams, answering six different questions.
Web analytics in one tool. Session behaviour in another. Sales call recordings in a third. Search data, support signals, experiment results, each in its own silo with its own owner and its own dashboard. Every tool could answer its own question. None of them could answer the question that mattered: what should we fix next?
So decisions defaulted to anecdote. The most recent customer complaint, the loudest stakeholder, the last thing someone happened to notice in a session recording. Not because people didn't care about evidence, but because assembling the evidence took longer than making the decision.
A dashboard tells you what happened. I wanted a system that tells you what to do about it.
Zooming out
Nobody asked for this. There was no brief, no ticket, no stakeholder request, because the problem wasn't visible as a problem. Fractured data was just how things were. What I could see was the downstream symptom: decisions being made on anecdote by smart people who'd have used evidence if evidence had been reachable. So I decided to fix the decision-making, which meant fixing the data underneath it. The job had three stages, and each one is worthless without the one before it:
Consolidate. One data model, all sources. A dashboard over fractured data is just fractured data with better typography; until analytics, behaviour and conversation data share a spine, no tool can reason across them.
Surface.Humans shouldn't trawl for patterns. The system should read the consolidated data and raise its hand: here's a friction point, here's how often it happens, here's what it's probably costing.
Act. An insight that ends as a slide is a dead insight. The output of the system should be the input to the next system: something you can accept, build and validate.
What I built
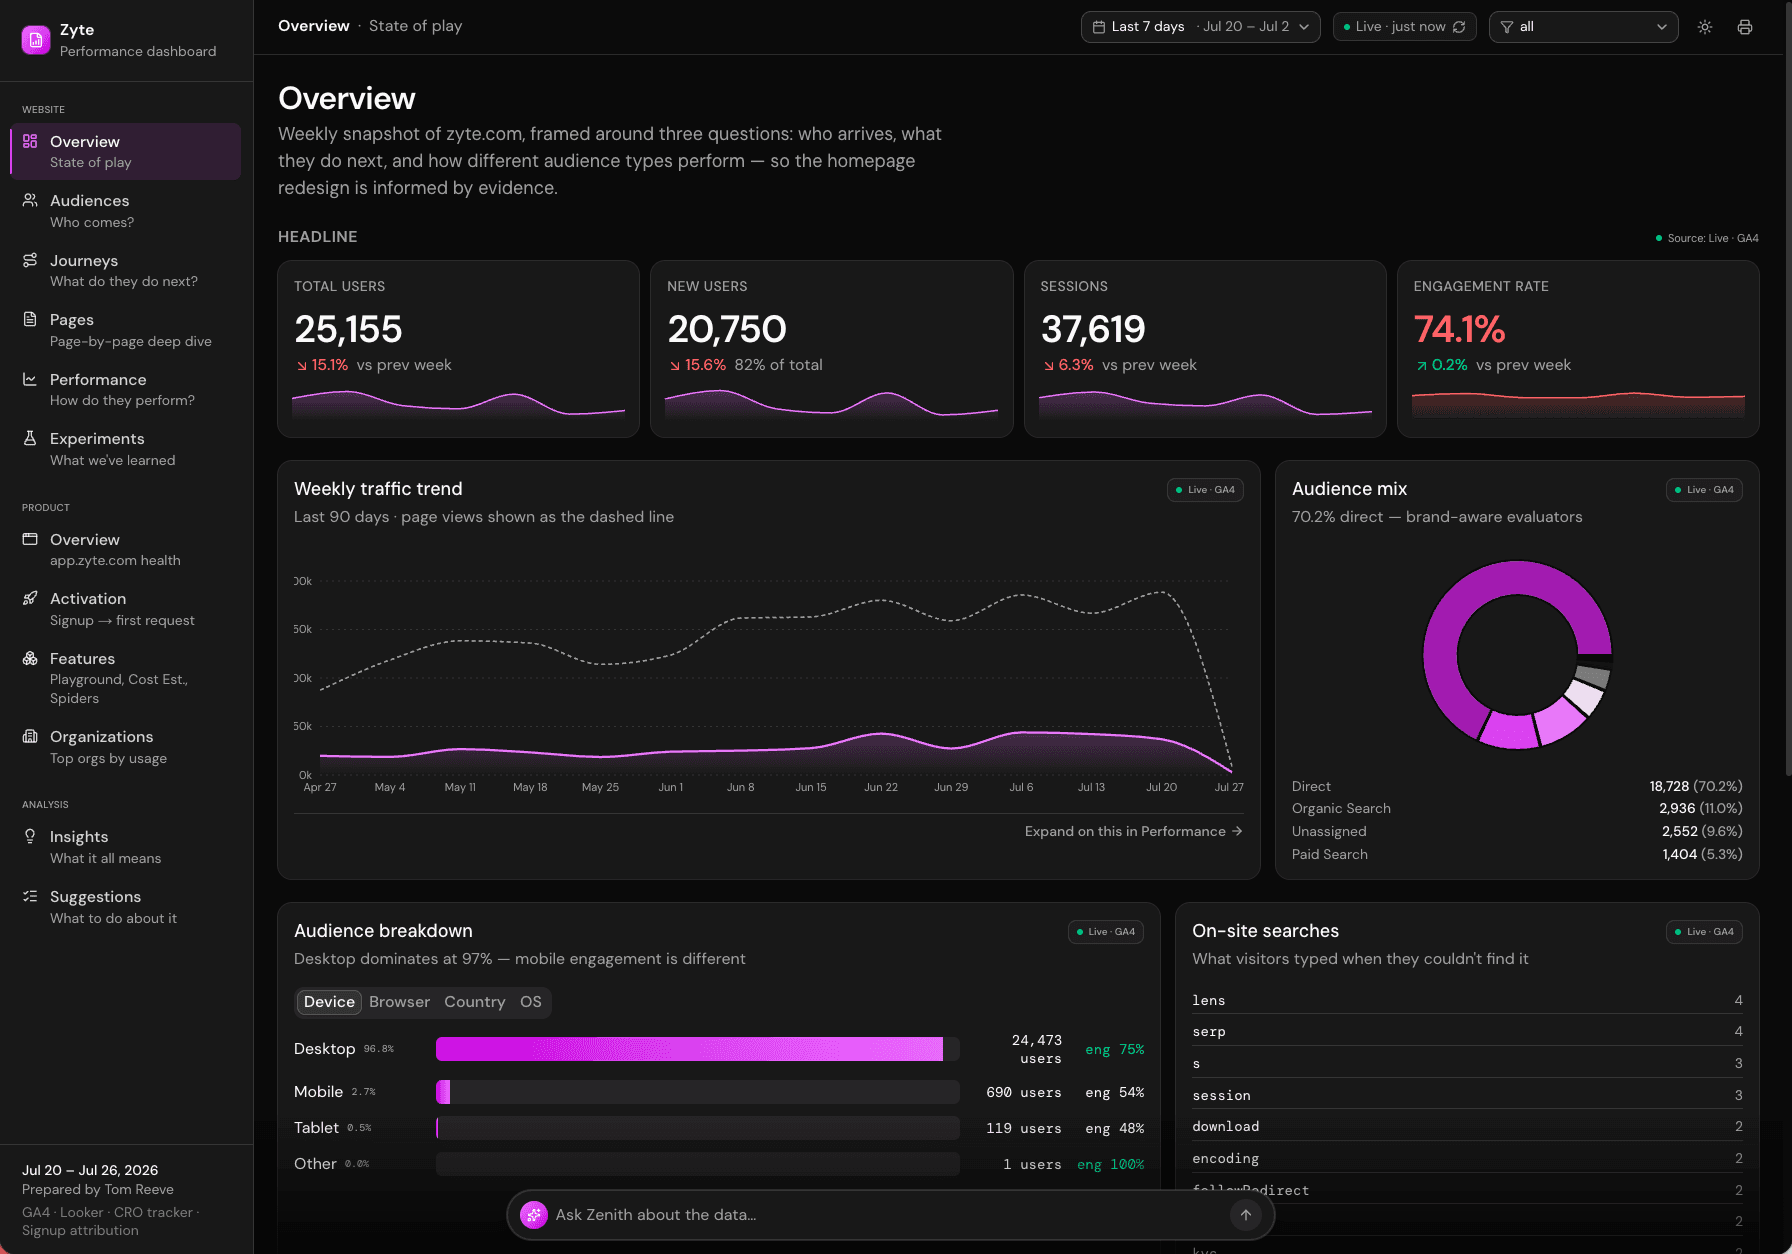
A consolidation layer, an analytics dashboard on top of it, and an AI insight engine on top of that.
The consolidation layer.Web analytics, user behaviour and sales conversation data pulled into one warehouse-backed model, so a question like "what do users struggle with on pricing" could draw on session behaviour and what prospects actually said on calls, in one query.
The dashboard.A single product view of the consolidated data, designed for decisions rather than reporting: less "here are forty charts", more "here's what changed and where to look."
The insight engine.The step that mattered most. AI reads across the consolidated signals, clusters related friction into candidate insights, and generates suggested problem statements ranked by frequency and likely impact on the two conversions we're accountable for. The system finds the problems; nobody has to go looking.
The loop. Then I connected it to Protozyte. An accepted insight becomes a prototype brief, the AI generates a working prototype, and it deploys for validation. Data raises the problem, a prototype tests the answer, and the results land back in the same data. The two platforms stopped being tools and became one system.
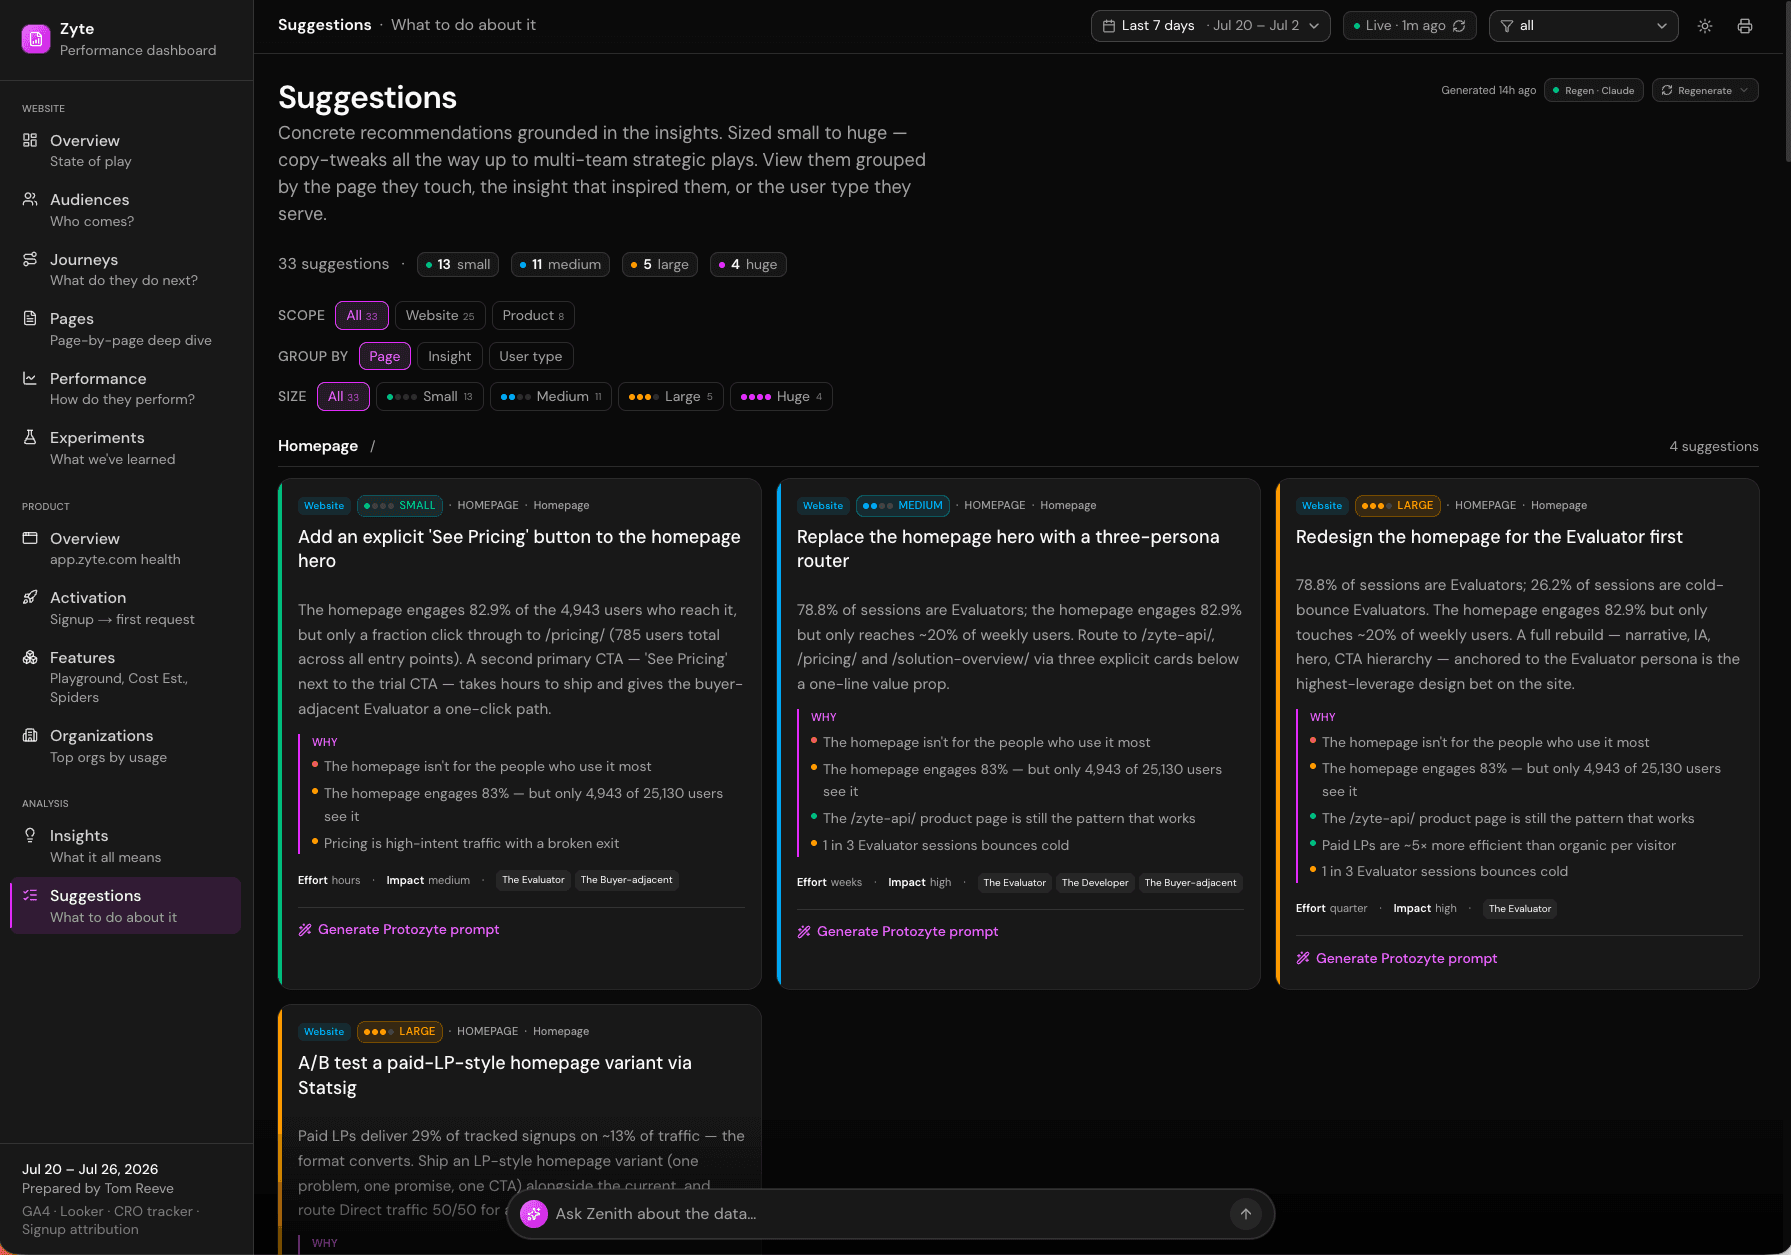
Auto-generated insights, ranked by frequency and impact, ready to accept or dismiss
The trade-offs
An AI insight system is easy to demo and hard to make trustworthy. The calls that made the difference:
- OrderConsolidate before you automateThe tempting move is to point an LLM at each silo and merge the answers. But insight quality is capped by data quality, so the unglamorous consolidation layer came first. AI on top of fractured data just generates confident fragments.
- HumanSuggestions, never actionsThe system proposes; a human accepts before anything gets built. An insight engine that acts on its own findings compounds its own errors. The approval gate is the design, not a limitation of it.
- CostA daily digest, not a live feedReal-time AI analysis is an expensive way to feel modern. Friction patterns change over days, not seconds, so batch processing delivers the same decisions at a fraction of the inference cost.
- OwnOwned pipeline over analytics SaaSOff-the-shelf suites stop at their own data. Building on our warehouse meant the insight engine could reason across sources no vendor connects, and feed a prototyping platform no vendor knows exists.
The outcome
Insights are ranked against the two numbers the squad is accountable for: visitor to paid subscriber, and visitor to data service enquiry. That's the difference between an insight engine and a curiosity engine. The system doesn't surface everything interesting, it surfaces friction sitting on the paths that convert, which is why the output can be worked straight through rather than admired and filed.
The conversation changed shape as a result. Instead of "I think users struggle with X", the starting point became "the system flagged X, here's the evidence, here's a prototype." Anecdote lost its seat at the table, not because anyone banned it, but because evidence became cheaper than opinion.
And the connection to Protozyte turned two internal tools into an operating capability: the organisation can go from a pattern in the data to a testable prototype without a discovery project in between. That's the piece I'd argue matters most, because it compounds. Every cycle through the loop makes the next one better informed.
The dashboard was never the product. The loop was: data in, insight surfaced, prototype live, result measured. I build systems that feed each other.